
Computational Anatomy
Computational Anatomy (CA) is an emerging discipline aiming at understanding anatomy by utilizing a comprehensive set of mathematical tools. CA focuses on providing precise statistical encodings of anatomy with direct application to a broad range of biological and medical settings. The mathematical notions of Riemannian geometry underpin CA as a modern formalism for the study of anatomical shapes with a central theme being the construction of large diffeomorphisms between smooth manifolds which represent specific anatomies.
1. Bayesian estimation of anatomical structural labels
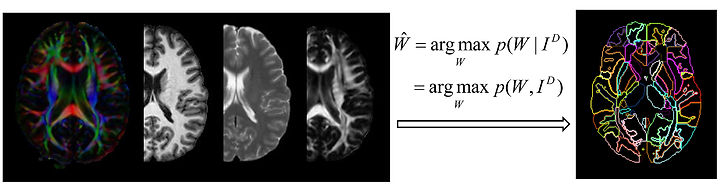
We have developed a methodology, the multi-atlas likelihood fusion (MALF) algorithm, for the estimation of various anatomical structures from MRIs. In MALF, the complete space of possible anatomies is modeled as the union of multiple anatomical orbits, each of which is evolved from its own distinct deformable atlas under the action of the group of diffeomorphisms. Each anatomy lies in one of the anatomical orbits, i.e. it evolves from a deformable atlas along a diffeomorphic path. Each atlas is regarded as an anatomical textbook, a vector-valued function defined on an ideal coordinate system. This textbook contains multifold anatomical information, including the grayscale intensity of the MRI, elucidatory information representing various anatomical structures, and the geometric properties of those structures. Identification of the biological parameters of interest in a test individual is accomplished via an intelligent learning of these distinct textbooks (atlases).
2. Statistical shape analysis via diffeomorphometry
-
Diffeomorphometry
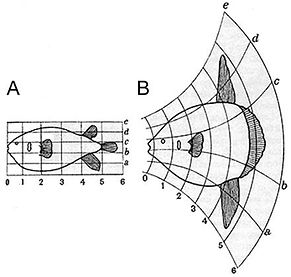
Given the sheer complexity and the cross-subject variability, it is challenging to quantitatively compare individual anatomies, especially the local properties, without any spatial correspondence. Our preferred way to address this is to model anatomies as Riemannian manifolds, turning the biological anatomy space into a metrizable space, paired with between-space diffeomorphic connections. The metric is induced as the shortest length for a geodesic in the space of diffeomorphisms that starts at the identity map and finishes at an optimal diffeomorphism between two anatomical manifolds. Comparative analysis of the anatomical phenotype between two clinical groups can therefore be phrased in terms of properties of those geodesics which stem from a common coordinate system (an anatomical template), which we term diffeomorphometry. These diffeomorphisms endow the space of anatomy with geodesic coordinates.
-
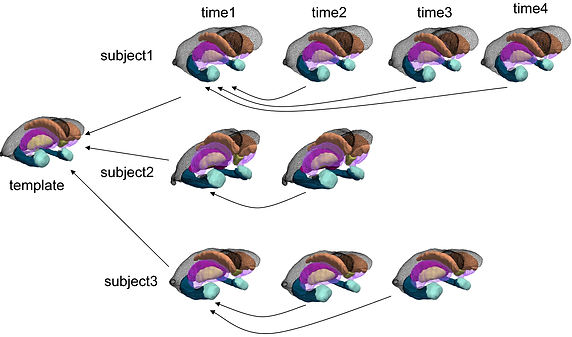
Cross-sectional and longitudinal statistical shape analysis
-
Representative results on clinical data
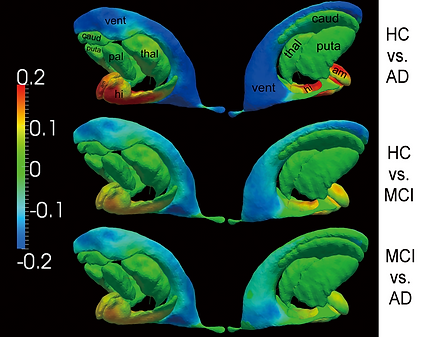
Group differences, between every two of the three groups, measured in the surfaces of all the seven structures. Warm color denotes regions where the corresponding structure has significant atrophy in the latter group when compared with the former group. Cool color suggests local expansion of the structure in the latter group when compared with the former group.

Top and bottom panels show the shape analysis results for the left hippocampus and the right hippocampus respectively. In each panel, sub-panel a) shows the average annualized shape atrophy rate of the HC group at each vertex of template surface for the corresponding structure. Sub-panels b)-d) illustrate the regional shape atrophy rate differences between HC and AD (sub-panel b)), HC and MCI (sub-panel c)), as well as MCI and AD (sub-panel d)), that are statistically significant after multiple comparison correction at a level of 0.05. In each sub-plot, results from two views are presented.
3. Changepoint model estimation for Alzheimer's disease

There are a variety of biomarkers affected by the pathology of Alzheimer's disease (AD). These biomarkers' abnormality starts (abnormality onset) preceding to the clinical detectable time (clinical onset). Normal aging and AD mainly differ in the rates of change they have induced for the biomarker abnormlity. We would like to:
1) Estimate the probability distribution of the clinical onset time;
2) Estimate the changepoint time (the value of detla);
3) Linear mixed-effects statistical modeling utlizing longitudinal measures;
4. Machine learning in the space of diffeomorphisms

Discrimination between normal aging and Alzheimer’s disease based on shape neuroinformatics

Predicting whether a subject with mild cognitive impairment will convert to Alzheimer’s disease in future based on shape informatics
5. Large deformation diffeomorphic metric mapping (LDDMM)

References for LDDMM:
Miller MI, Trouve A, Younes L (2002): On the metrics and euler-lagrange equations of computational anatomy. Annu Rev Biomed Eng 4: 375-405.
Miller MI, Trouve A, Younes L (2006): Geodesic Shooting for Computational Anatomy. J Math Imaging Vis 24: 209-228.
Beg MF, Miller MI, Trouvé A, Younes L (2005): Computing large deformation metric mappings via geodesic flows of diffeomorphisms. Int. J. Comput. Vis. 61 (2): 139-157.